Practice Portfolio – Infographic Design
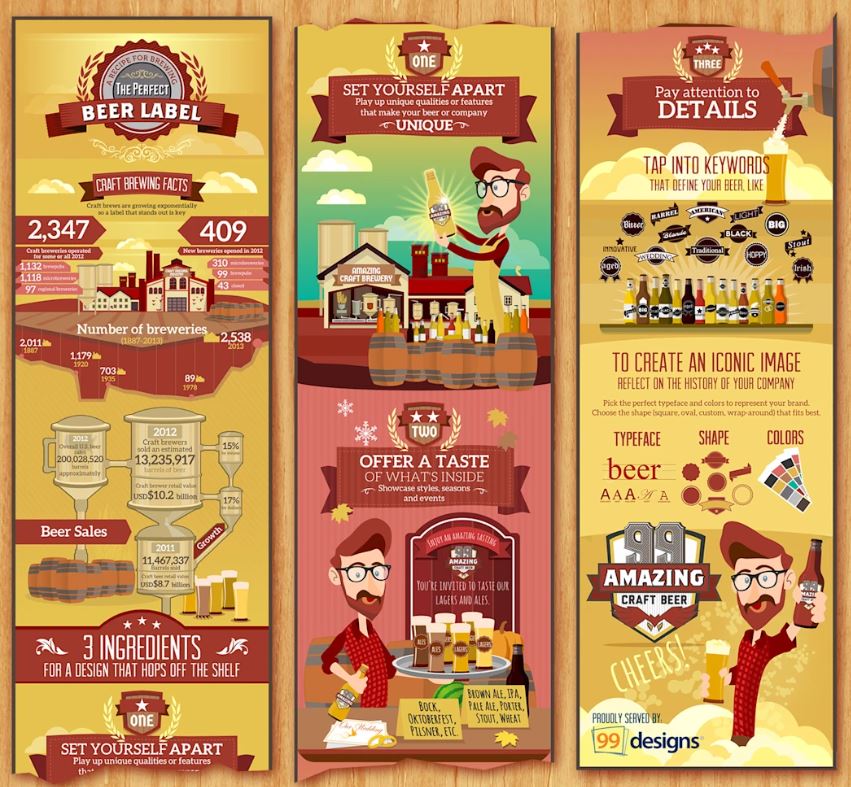
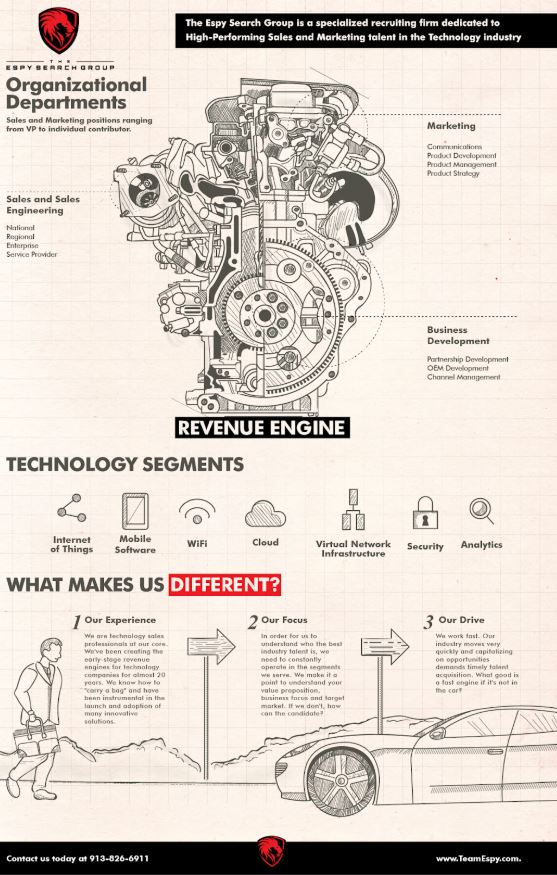
Practice Portfolio – Infographic Design focuses on transforming complex information into visually engaging graphics. By combining design elements like color, typography, icons, and illustrations, it simplifies data for easy understanding. The key is balancing aesthetics with clarity, helping the audience quickly grasp essential insights without feeling overwhelmed.
Infographic
Created by : @Adobe Creative Cloud
Key Elements of Infographic Design
- Data Visualization: The use of charts, graphs, and diagrams to present data clearly and concisely. This allows complex information to be processed visually, helping users grasp trends and comparisons effortlessly.
- Color Scheme: A well-chosen color palette can enhance readability and highlight important data. Color can also evoke emotions or reinforce a brand identity, making it a critical element in design.
- Typography: Selecting appropriate fonts and establishing hierarchy is key to guiding the viewer’s attention. A combination of fonts should be used for titles, subtitles, and body text for clarity and emphasis.
- Icons and Illustrations: Visual elements such as icons and illustrations can represent ideas and concepts effectively. Custom icons help reinforce the message while making the design more engaging.
- Layout and Composition: Organizing content with sufficient white space ensures that the infographic doesn’t feel overcrowded. Logical flow and alignment make it easier to navigate and understand the data.
Types of Infographics
- Statistical Infographics: Focused on presenting numbers and data in a visual format, often using bar graphs, pie charts, and line graphs to convey trends and comparisons.
- Timeline Infographics: Used to present data or events in chronological order, perfect for illustrating historical events or project timelines.
- Comparison Infographics: Display two or more items side by side to highlight similarities or differences, ideal for product comparisons or performance analysis.
- Process Infographics: These infographics are great for explaining step-by-step processes or workflows, helping viewers understand how something works or progresses.
- Geographical Infographics: These focus on location-based data or maps, often used to showcase regional trends, demographics, or survey results.
Infographic Design Process
- Understanding the Data: Start by analyzing and interpreting the data you want to present. Identify key trends and focus on the most relevant points.
- Creating a Concept and Structure: Determine the infographic style, layout, and flow. Sketch wireframes or create a rough design to visualize the structure.
- Designing the Visual Elements: Choose the right charts, graphs, and icons to represent the data clearly. Ensure the design is visually appealing while maintaining clarity.
- Refining and Testing: Review the infographic for accuracy, readability, and design balance. Test the design with a small audience to gather feedback and refine it.
- Finalizing the Design: Ensure the infographic is optimized for digital or print use. Export the file in suitable formats like PNG, PDF, or JPEG for sharing and distribution.
Tools for Infographic Design
- Canva: A popular tool for beginners, offering pre-designed templates and an easy drag-and-drop interface for infographic creation.
- Adobe Illustrator: A professional-grade tool with advanced design features, perfect for creating custom infographics from scratch.
- Venngage: An intuitive online infographic maker that provides customizable templates for a variety of purposes.
- Piktochart: Offers a range of templates and visual elements to design stunning infographics, with both free and paid options.
- Easel.ly: A user-friendly tool for creating basic infographics quickly with pre-made templates and design elements.
Objective: Create an engaging infographic that visually communicates information about a personal skill or hobby they are passionate about.
Instructions:
- Select a hobby or skill you are passionate about (e.g., cooking, gaming, painting).
- Research and include the following sections in your infographic:
- Introduction to the hobby or skill
- A step-by-step guide or process for beginners
- Benefits of pursuing this hobby
- Tools or resources required
- Fun or surprising facts
- Use icons, charts, and visual elements to make your infographic appealing.
- Focus on color harmony and a cohesive layout for a professional design.
Tools to Use:
- Canva
- Figma
- Adobe Illustrator
Deliverable: Submit the infographic as a high-resolution PNG or PDF.

Objective: Critique and enhance an existing infographic, focusing on design principles and clarity.
Instructions:
- Review the provided infographic and identify at least three design flaws (e.g., poor typography, lack of contrast, cluttered layout).
- Redesign the infographic to improve:
- Information hierarchy
- Visual appeal
- Readability and accessibility
- Use a grid system to ensure consistent alignment.
- Incorporate balanced use of visuals and text.
Design Tips:
- Choose a minimal color palette for a clean design.
- Use appropriate typography to enhance readability.
- Ensure ample white space for a polished look.
Tools to Use:
- Adobe Illustrator
- Canva
- Figma
Deliverable: Submit the redesigned infographic as a PNG or PDF with a brief explanation of the changes made.

Report abusive, offending, missing or broken link report@prodesignschool.com
Join Our Mail List
To get latest updates on courses and news regarding education.